Lower Back Pain is Increasing in Prevalence. What are the Reasons?
Posted by Phil Heler on June 20, 2020In the UK, over the last 20 years, there has been a 12% increase in how likely a person is to experience disability because of low back pain.
Lord Byron said ‘adversity is the first path to truth’ but, let’s face it, it certainly does not feel that way when you struggle to get off the sofa with intense lower back pain! There are not many of us that need an introduction to lower back pain and we all understand first hand how seriously debilitating it can be.
We cannot turn over in bed, socks become an issue, slip on shoes suddenly seem like the best idea ever and there is an all round serious loss of dignity. I have seen many people in these humbling moments.
How common is Lower Back Pain?
Lower back pain is the largest single cause of disability in the UK according to the NHS, accounting for 11% of the total disability of the population.
The Office of National Statistics state that almost 31 million workdays were lost in the UK in 2016 due to musculoskeletal problems including back pain. That’s a lot of people at home with no socks on watching box sets on the sofa unable to move.
When you translate all these moments into pounds and pence the costs attributable to low back pain in the UK are estimated at £12.3bn a year, with £1.6bn spent on treatment. A small percentage of us may require more than just some form of treatment.
Unfortunately this all means that referrals for spinal surgery are also increasing year on year. In the UK, over the last 20 years, there has been a 12% increase in how likely a person is to experience disability because of low back pain. I decided to look into some of the reasons why this disturbing trend is happening.
According to a Global Burden of Disease Study (GBD) the lifetime prevalence of non-specific (common) low back pain is estimated at 60% to 70% in developed industrialised countries where presumably data is most readily available. As the bar chart below explains prevalence appears to increase and peak between the ages of 35 and 55 especially in Western Europe. I myself fall neatly in this category!
These studies also introduced a new metric unit (the disability-adjusted life-year or DALY) to express the burden of any one disease of injury. The DALY is based on years of life lost from premature death and years of life lived in less than full health.
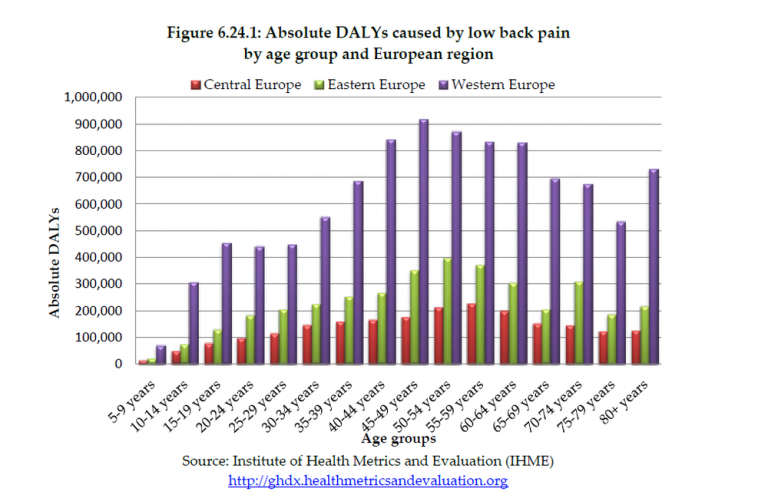
The overall global burden of lower back pain just from work related incidents alone was calculated at 21.8 million DALYS with 13.8 million in males and 8.3 million in females. I am not only in age group that experiences the highest prevalence of LBP but also male! For those of you who are not familiar with Global Burden of Disease Studies, they are published each year.
They detail a bewildering amount of information about mortality and disability from virtually all major diseases, injuries, and risk factors. They are typically researched by hundreds of experts worldwide including the World Health Organisation (WHO), Harvard School of Public Health, the Institute for Health Metrics and Evaluation (IHME), and the World Bank.
Back Pain is a Complex Issue
LBP comes in all forms whether acute, sub-acute, or chronic. Having spent many years doing my job I am only too aware of the plethora of causes and the constellations of different symptoms that are possible. I do know that occupational posture in the workplace, age, height, weight, genetics, a multitude of different traumas and incidents serve to contribute as risk factors but there is so much detail that is missing.
This has been well recognised and the phrase ‘non-specific lower back pain’ is now a widely accepted academic and professional term. The reasons for this come down to the anatomy of the spine.
Although the spine is basically comprised of twenty-four repeating units (or vertebra) with intervertebral discs in between there are so many further layers of complexity and potential anatomical sources of pain. These layers include many muscle groups of varying size that both support and allow movement of the spine. Many of these muscles integrate with the head and neck anatomy, the shoulder complex, and the pelvis.
Then we have an infinite number of ligaments to secure these repeating units, enabling them to act as one. It does not end here of course . Each repeating unit (or vertebra) has four joints to permit articulation with the unit above and below meaning that we have 96 spinal joints. Then there is the spinal cord and the dozens of departing the nerves.
We have also abdominal organs and connective tissue (or fascia) that can act as LBP sources. Pain can be spawned from aberrant neurological pain pathways (fibromyalgia). Psychological factors such as stress can promote pain. Although my understanding of anatomy is thorough when I examine a lower back the reality is that there is a bewildering myriad of information. The idea that LBP is ever specifically related to one individual muscle, ligament or joint is unrealistic.
The phrase ‘non-specific lower back pain’ really does earn its stripes. Probably 80% of the people we see fall into this category although this does not imply that we do not possess a reasoned rationale for treatment. It is just a complex clinical decision-making process that is challenging.
In broad terms the other two key categories of LBP are radicular pain (such as trapped nerves or sciatica), and pain caused through degenerative processes. Combined with ‘non-specific lower back pain’ these overlap like a Venn diagram so neither is uniquely distinct in nature. So why is lower back pain an increasing phenomenon?
Age Profile and the Relationship with Back Pain
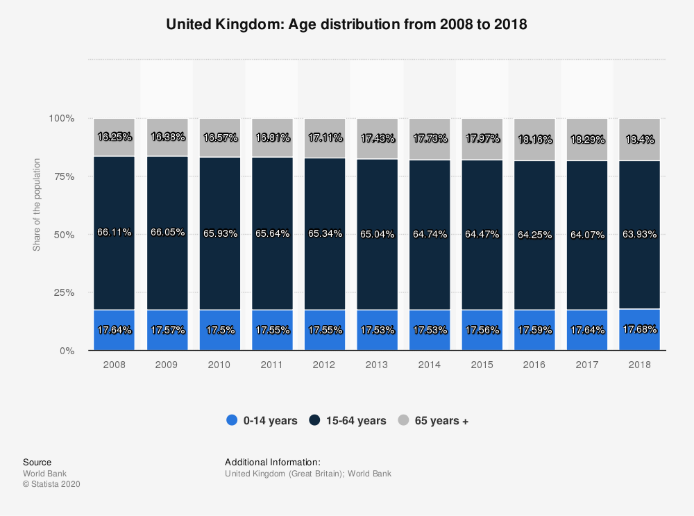
Unfortunately, population age profiles are gradually creeping up, and we are all held hostage by time. The over 65 age group represented 13.25% of the population in 2013 and 2018 this rose to 18.4% and projected to be nearly 20% by 2024. Lower back pain will inevitably increase in prevalence, this will impose a high economic burden on individuals, families, communities, industry, and governments. In England it is one of the most common reasons for both hospital admissions and GP consultations.
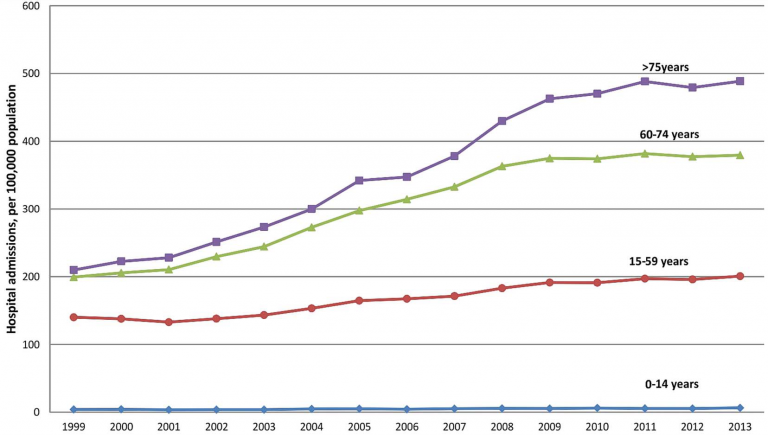
In 2017 one study published in the British Medical Journal collated the numbers of hospital admissions for LBP between 1999-2013. Over this 15-year period overall hospital admissions for LBP, increased from 127.09 in 1999 to 216.26 in 2013, per 100 000 population. This represents a 1.7-fold increase or an annual increase of 7.63 people per 100 000. T
he greatest increase was seen across older age groups. The most significant trends were in those aged 60–74 and ≥75 years. Admissions for 60-74-year olds increased from 199.43 to 379.34 per 100,000 over 15 years and from 209.96 to 488.60 per 100,000 for the over 75s.
Over this fifteen-year study period, there was also a significant increase in the overall number of surgical procedures performed for degenerative lumbar spine disease. Recorded procedures almost doubled from 24.5 to 48.83 per 100 000.
Only 2-5% of people overall with LBP are elected for surgery with the most common reason being compression of nerve roots (or trapped nerves). This can happen either as a degenerative process or as a traumatic herniated disc prolapse common in younger age groups. In 2010–2011 for instance 236,801 people finished consultant episodes within NHS England for all categories of spinal intervention. By 2017-18 this had increased to 253,500 with 211,000 people undertaking spinal injections and 52,523 undertaking surgical procedures.
Next week I intend to outline the most common surgical procedures that make up these numbers.