PM 2.5 levels & Air Pollution & Our Health
Posted by Phil Heler on December 8, 2020This week in the UK there was a landmark legal case that identified air pollution as a cause of death. On a global basis in the capital city of Mongolia, Ulan Bator, in 2018, a government-installed sensor reported a PM2.5 per cubic meter rate of 3,320 μg/m3 in Ulan Bator. The World Health Organization (WHO) level is 10 μg/m3.
We are one week closer to Christmas, but December also brings us some notable anniversaries. On the 9th December 1960 Coronation Street was aired for the very first time. This was an ambitious project by Tony Warren that bucked the trend when television at the time was very ‘London-centric’. The unfolding story of ordinary northern people set in a pub, a factory, a café and various living rooms has endured for sixty years and has now aired 10,101 episodes.
On a scientific note in December 1919 an astronomer, Arthur Stanley Eddington, set out on an expedition to Brazil and then to West Africa to witness a total solar eclipse. Eddington measured the bending of sunlight during the eclipse caused by the sun’s gravity just as Einstein had predicted two years previously when he published his general theory of relativity in full mathematical detail. Ironically of course this was also set in a time of a global pandemic of Spanish flu which lasted from 1918-19.
One hundred years later we are all about to witness ‘a jolly good Christmas while being jolly careful’. This five-day reprieve from current measures has been widely criticised. Professor Gabriel Scally who is a member of the Independent SAGE committee stated, ‘there is no point in having a very merry Christmas and then burying friends and relations in January and February.’ That certainly takes the shine off things!

What is certain is that infections are likely to rise. ‘Notes on the Festive Period’ written by the Scientific Pandemic Influenza Group on Modelling (SPI-M) contains stark warnings about a substantial mixing of people over a short period of time. It states, ‘any relaxation over the festive period will result in increased transmission and increased prevalence, potentially by a large amount’. It is however down to every one of us ultimately to make a personal decision.
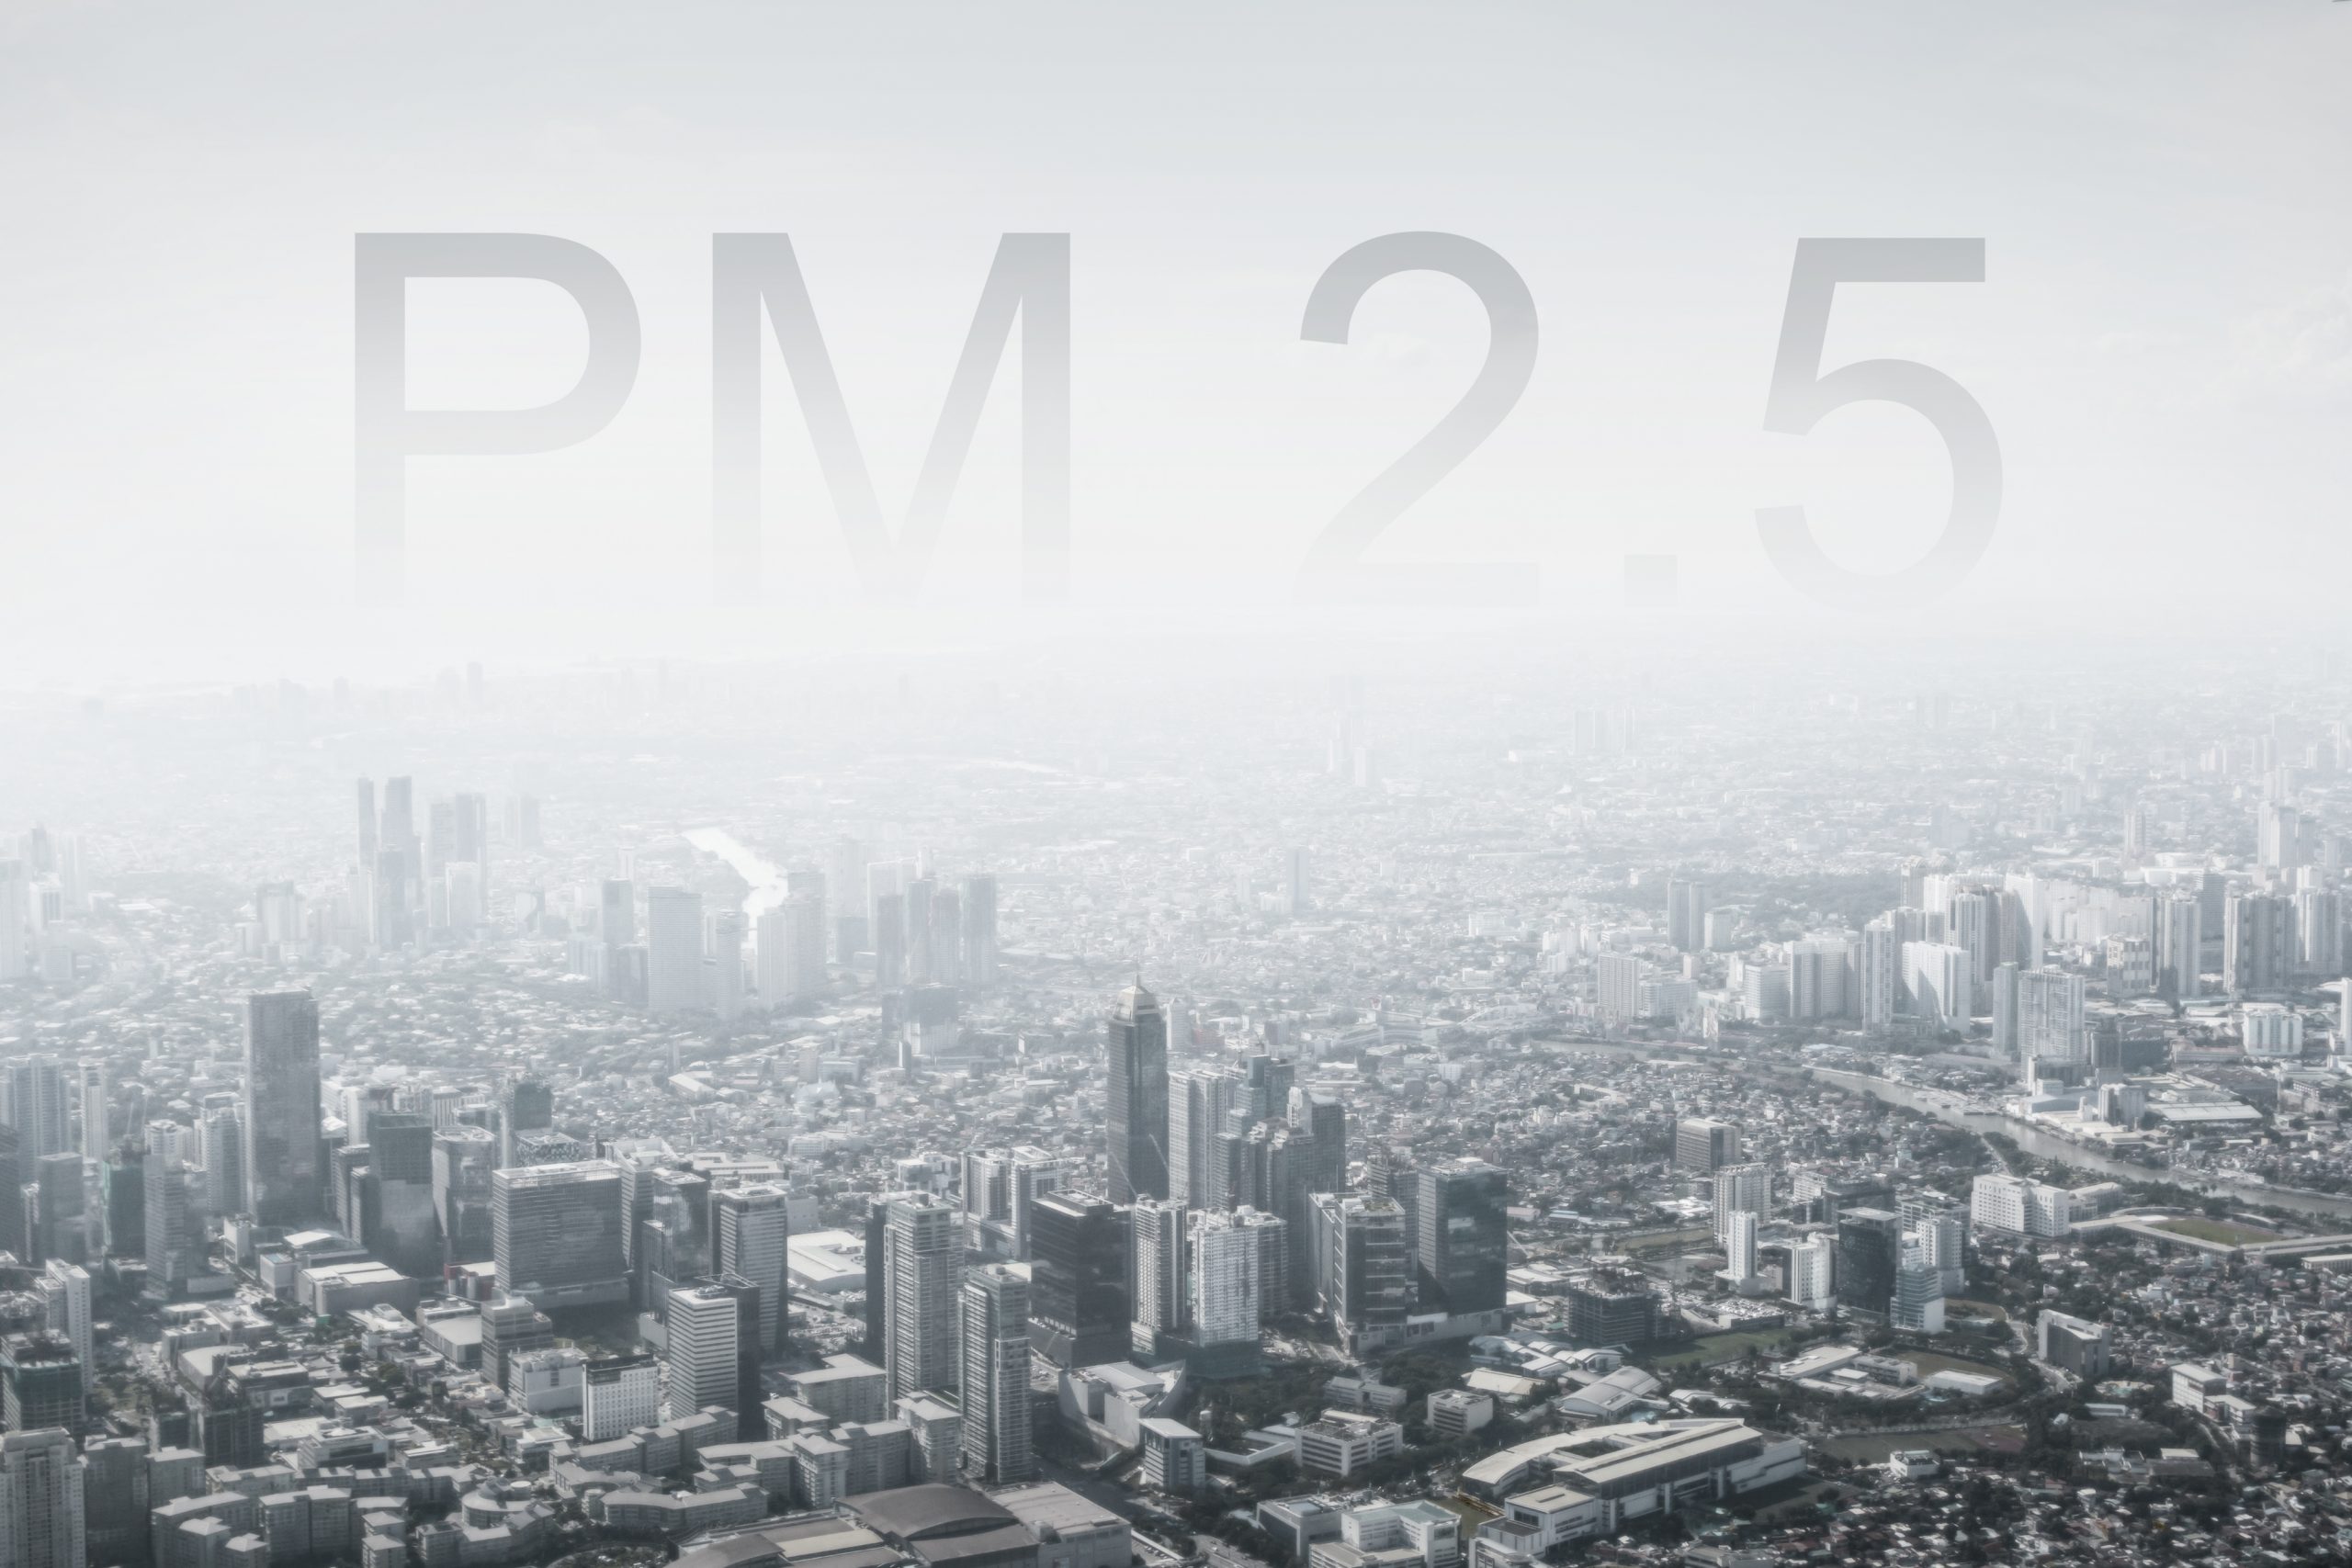
Air Pollution & PM2.5 and our Health
This week, following the conclusions reached at an inquest regarding the death of Ella Kissi-Debrah, I am writing about air pollution. This was a landmark legal case as air pollution has hitherto never been identified as a cause of death. Ella Kissi-Debrah died from an acute asthma attack at her primary school pupil in February 2013 in the London borough of Lewisham. Her lawyers linked her death to heavy traffic on London’s South Circular near her home. Her death coincided with one of the worst air pollution surges in her local area. Between 2006 to 2010 levels of nitrogen dioxide (NO2) near her home consistently exceeded the annual legal limit of 40µg/m3. Air pollution has also recently been in the news for other reasons.
Recently there have been some interesting observations in the US about air quality and confirmation of a direct link to a greater risk of poor COVID-19 outcomes. No country is unaffected by pollution. Human activities, including industrialisation, urbanisation, and globalisation, are all drivers of pollution.
So, the correlation between a multisystem disease that primarily affects our respiratory systems and the quality of the air we breathe would appear to make sense. Pollution and air quality has never been more relevant. Today 55% of us live in urban areas and this is set to rise to 68% by 2050 with close to 90% of this increase taking place in Asia and Africa (according to United Nations data). Our urban populations have grown from 751 million in 1950 to 4.2 billion in 2018.
What Air Pollution is Made up of?
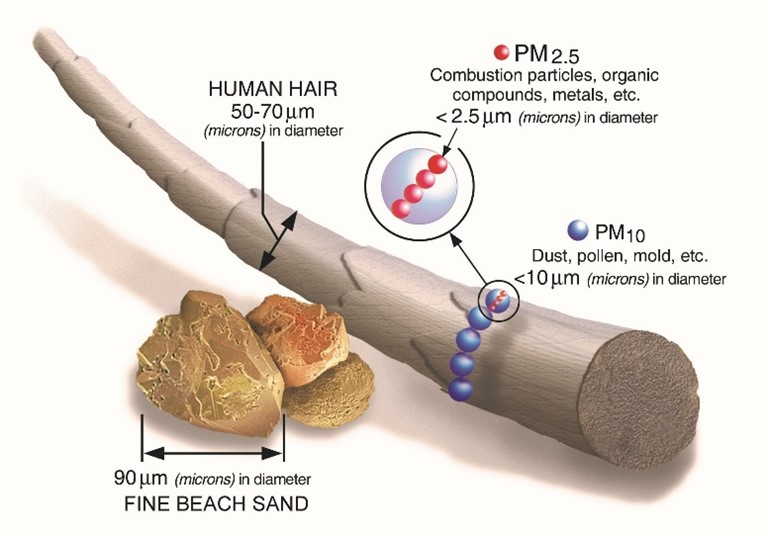
A study performed earlier this year at Harvard University found an increase in air pollution led to an increased mortality rate of up to 11% for those affected by COVID-19. The study measured particulate matter in the air known as PM2.5. This term, as you would imagine, refers to tiny particles or droplets in the air that are 2.5 microns or less in width and hence the term PM2.5 (PM is obviously Particulate Matter).
To give you an idea how small this is there are 10,000 microns in a centimetre. The widths of the larger particles in the PM2.5 size range would be about thirty times smaller than that of a human hair. The smaller particles are so small that several thousand of them could fit on the full stop at the end of this sentence.
Much of this pollution is generated largely from fuel combustion from vehicles, refineries, and power plants. There are also natural sources such as volcanic eruptions and forest or bush fires. Events such as wildfires or volcanic eruptions can raise fine particle concentrations hundreds of miles from the source of the event.
Even Saharan dust is relatively common in the UK often happening several times a year when big dust storms in the Sahara coincide with southerly wind patterns. In certain weather situations, Saharan dust can also affect air pollution and pollution levels.
Unfortunately, in a more general sense, levels vary from country to country and much of this is tied in with socioeconomics. Particulate matter in terms of air pollution is not the only risk. There is also exposure to ozone (O3), nitrogen dioxide (NO2) and sulphur dioxide (SO2). As with particulate matter, concentrations of these other substances are often highest largely in the urban areas of low- and middle-income countries.

Ozone for example is a major factor in asthma morbidity and mortality, while nitrogen dioxide and sulphur dioxide also can play a role in asthma, bronchial symptoms, lung inflammation and reduced lung function.
Our Harvard study in the US found that even an extra microgram of particulate matter per cubic metre of air over the long term could cause an increase in mortality rate of 11% when affected by COVID-19. This increase was typical for people who had lived for decades in a county with high levels of fine particulate pollution.
The researchers looked at more than 3,000 counties across the US and directly compared levels of fine particulate air pollution with mortality rates from COVID-19. They then adjusted for influential variables such as population size, hospital beds, number of people tested for COVID-19, weather, and socioeconomic and behavioural variables such as obesity and smoking before drawing conclusions.
Obviously, the point of the study at the time was to predict where health care resources should be focused and concentrated. The researchers wrote, ‘The study results underscore the importance of continuing to enforce existing air pollution regulations to protect human health both during and after the COVID-19 crisis.’
However the impact of pollution also has a much wider-ranging impact on general global health even outside the pandemic as we mentioned earlier.
The Impact of Air Pollution
Pollution is responsible for an estimated 9 million premature deaths, or one in six of all deaths worldwide, according to a 2017 study published in the medical journal The Lancet. More than 90% of those fatalities occurred in low or middle-income countries.
In these countries exposure to airborne pollutants in and around homes from household combustion of fuels on open fires or traditional stoves for cooking, heating and lighting exacerbates the risk for air pollution-related diseases, including acute lower respiratory infections, cardiovascular disease, chronic obstructive pulmonary disease and lung cancer.
In 2016, Ulan Bator, the capital of Mongolia, overtook both New Delhi and Beijing as the capital with the highest air pollution levels in the world. This is in part due to the city’s topography as, just as in Beijing, it is built in a river valley surrounded by mountains that serve to trap air pollution.
Climatic extreme is another cause. Ulan Bator is the world’s coldest capital; the average January low is -33C, the point at which Fahrenheit and Celsius intersect. In 2018, a government-installed sensor reported a PM2.5 per cubic meter rate of 3,320 μg/m3 in Ulan Bator. The World Health Organization (WHO) level is 10 μg/m3. Pneumonia is now the second-leading cause of death in children under 5 years old.
World Health Organisation air quality guidelines estimate that reducing annual average fine particulate matter (PM2.5) concentrations from levels of 35 μg/m3, common in many developing cities, to the WHO guideline level of 10 μg/m3, could reduce air pollution-related deaths by around 15%. However, even in the EU, where PM concentrations in many cities do comply with guideline levels, it is estimated that average life expectancy is 8.6 months lower than it would otherwise be, due to PM exposures from human sources.
But there is hope. As the largest developing economy, China is heavily affected by PM2.5 pollution resulting from processes of rapid expansion. To reduce PM2.5 pollution, the State Council of China launched the Air Pollution Prevention and Control Action Plan (APPCAP) in 2013.
This aimed to lower PM2.5 concentration in cities by 10–25% by 2017. Costing about $270 billion, covering more than 300 cities all around China, APPCAP is by far the largest air pollution control action ever implemented. The Ministry of Ecology and Environment of China declared in 2018 that the PM2.5 concentration target of the APPCAP had been achieved. Over this time period, PM2.5 concentrations decreased from 62 to 42 μg m3 and PM2.5 -attributable mortality declined by 0.41 million people. PM2.5 concentration changes were largely driven by emissions reductions from industry and promoting clean fuels in the residential sector.